The bond market contains a huge amount of information about how investors view the economy. One of the most closely watched indicators is the yield curve, which compares the interest rates, or yields, of bonds with different maturity dates.
The yield curve is particularly useful because it can provide clues about expectations for interest rates, inflation, economic growth, and financial conditions. It can also help explain why investors pay attention to the relationship between short-term and long-term interest rates.
Understanding the yield curve does not require advanced financial knowledge. At its core, it is simply a way of comparing borrowing costs across different time periods.
What Is a Yield Curve?
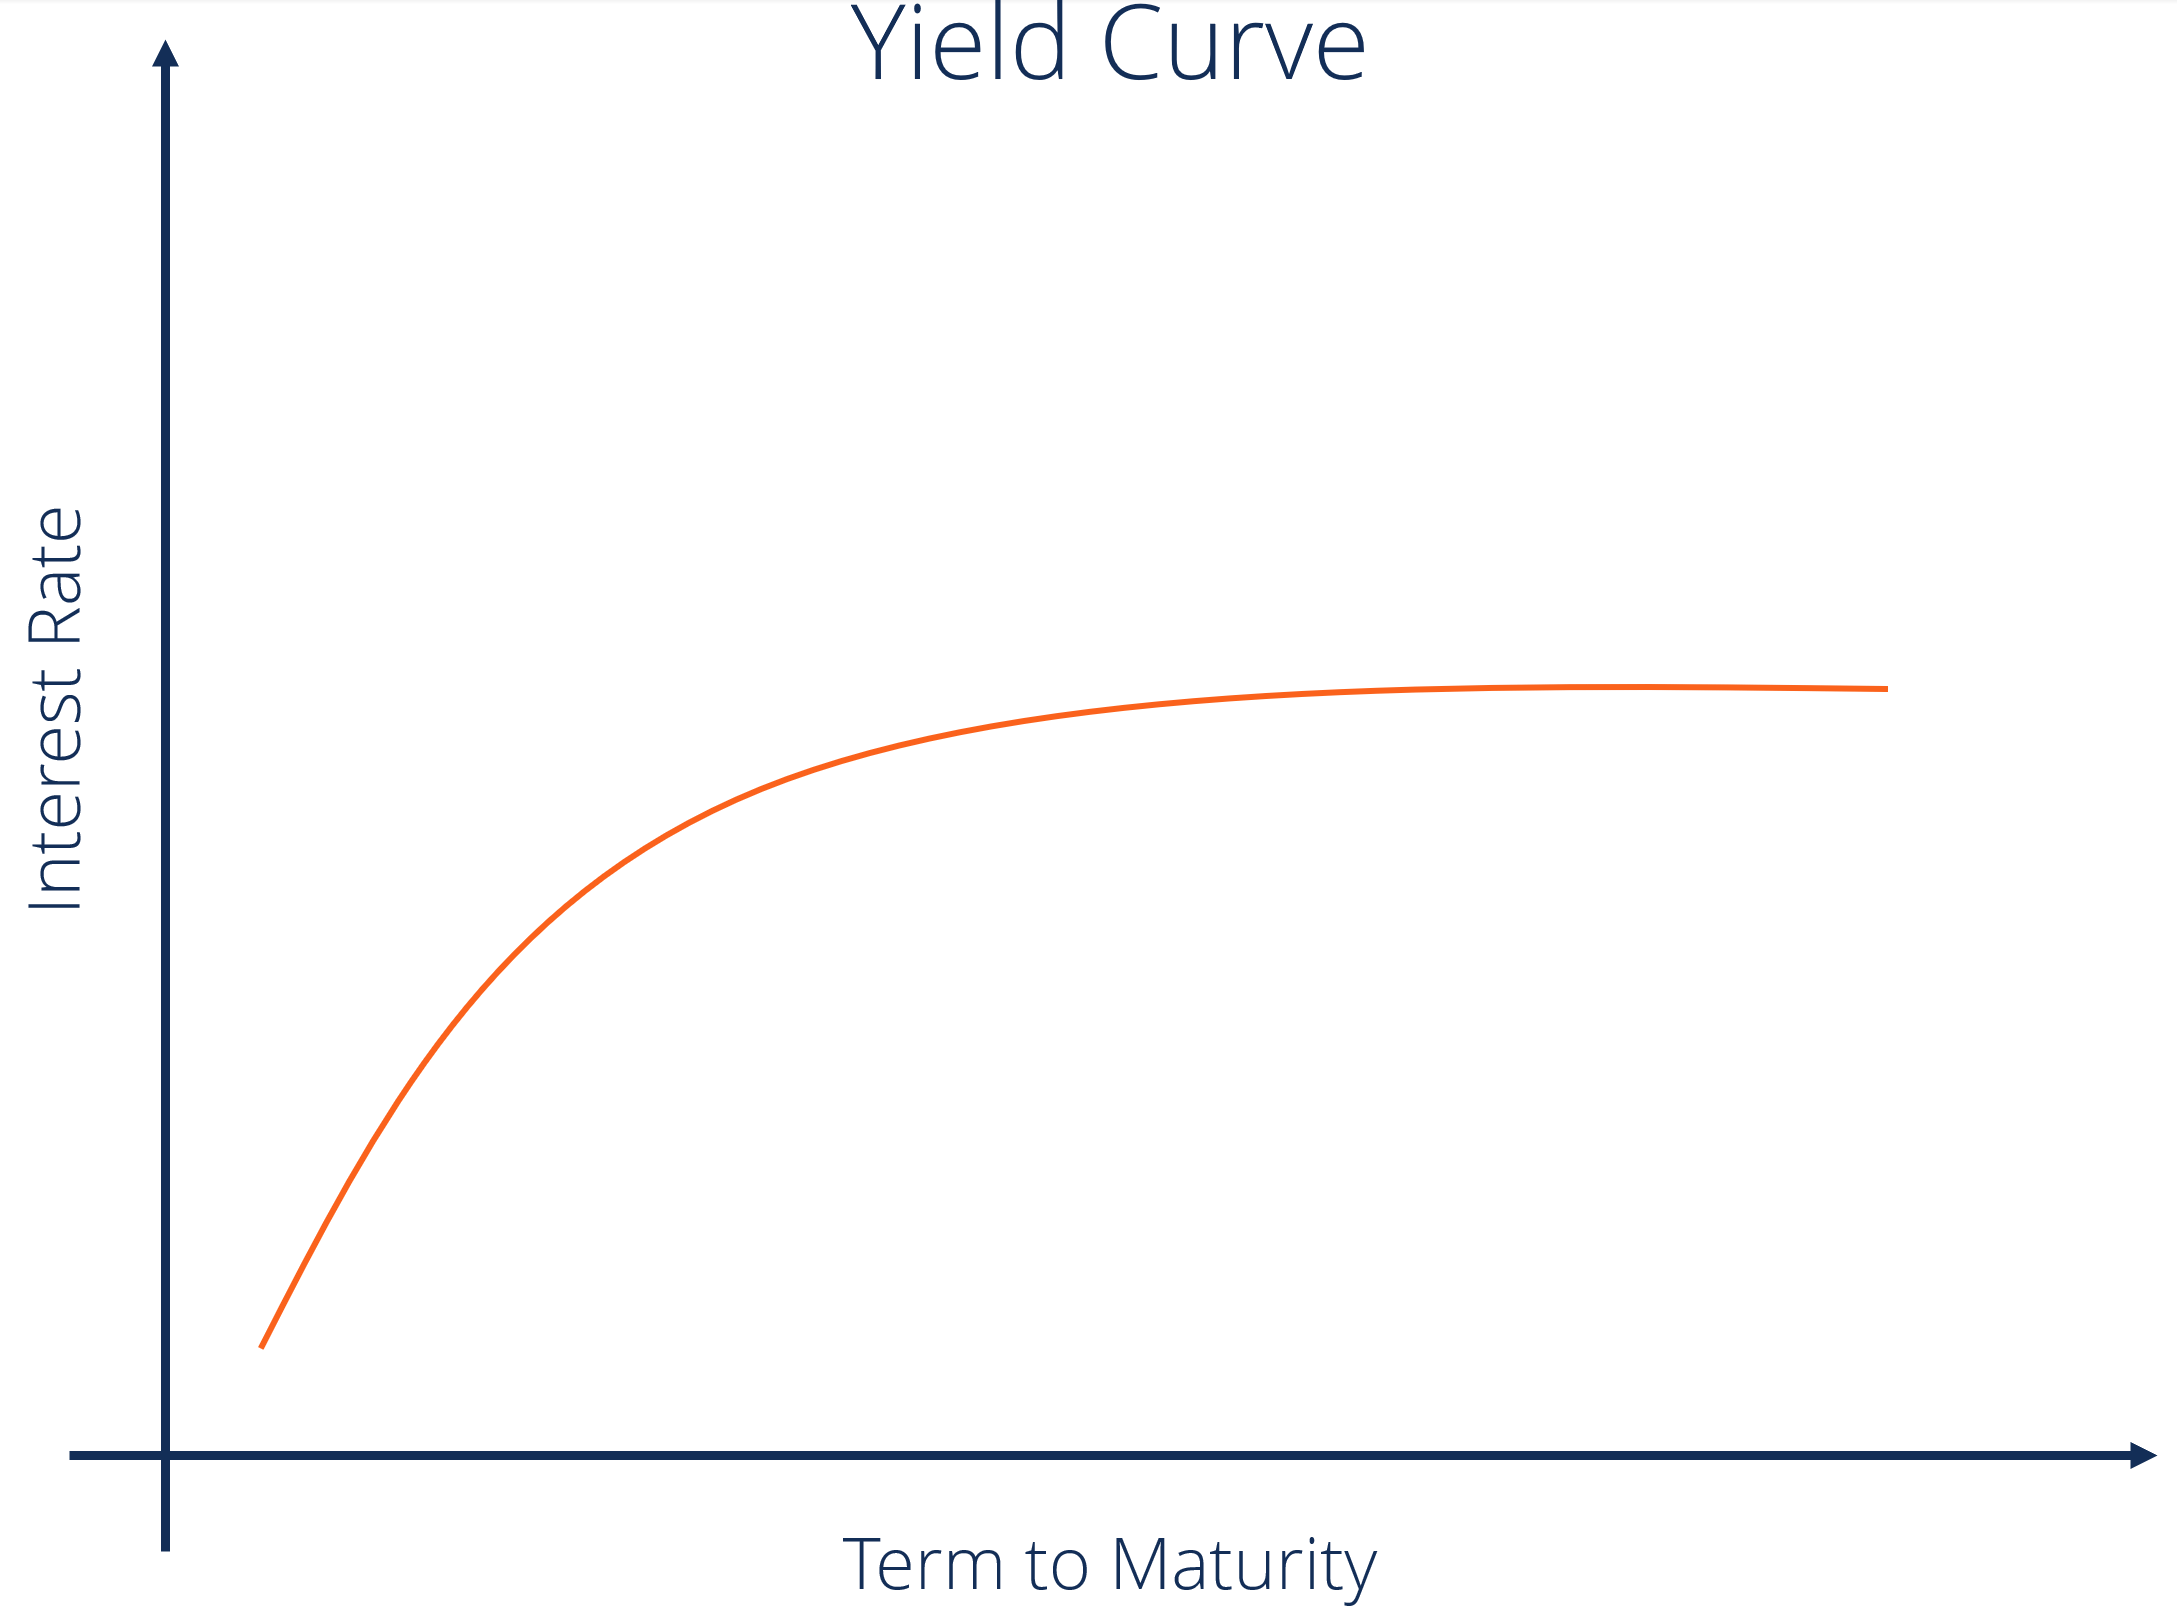
A yield curve is a graphical representation of bond yields across different maturities.
The most commonly discussed yield curve is based on government bonds because these securities are generally considered important benchmarks for the broader financial system.
Imagine that government bonds have the following yields:
- 2-year bond: 3.5%
- 5-year bond: 3.8%
- 10-year bond: 4.1%
- 30-year bond: 4.5%
When these yields are plotted on a graph, they create an upward-sloping curve.
The horizontal axis represents the amount of time until the bonds mature, while the vertical axis represents their yields.
By looking at the shape of the curve, investors can see how the market is pricing different periods of time.
What Is a Normal Yield Curve?
A typical yield curve slopes upward.
This means longer-term bonds have higher yields than shorter-term bonds.
There are several reasons this can happen. Investors may require additional compensation for committing their money for a longer period. They also face greater uncertainty about future inflation, economic conditions, and interest rates.
For example, an investor may be comfortable lending money to a government for two years at 3%. But committing that money for thirty years could require a higher return because much more can change over that period.
An upward-sloping curve can therefore indicate that investors expect some combination of economic growth, inflation, and higher future interest rates.
What Is an Inverted Yield Curve?
An inverted yield curve occurs when short-term yields are higher than long-term yields.
For example:
- 2-year bond: 4.5%
- 5-year bond: 4.1%
- 10-year bond: 3.8%
- 30-year bond: 3.7%
Instead of rising as maturity increases, yields decline.
An inverted yield curve often attracts attention because it can reflect expectations that interest rates will eventually fall.
If investors believe economic growth will weaken and central banks will reduce interest rates in the future, they may be willing to accept lower yields on longer-term bonds.
Why Does the Yield Curve Matter?
The yield curve matters because interest rates influence almost every part of the financial system.
Government bond yields can affect borrowing costs for businesses, mortgages, consumer loans, and other financial products.
The shape of the yield curve can also provide information about how investors view future economic conditions.
For example, a steepening curve may reflect changing expectations about growth or interest rates, while a flattening curve can indicate that the difference between short-term and long-term borrowing costs is narrowing.
The curve is therefore watched by investors, economists, banks, businesses, and policymakers.
Does an Inverted Yield Curve Guarantee a Recession?
No.
An inverted yield curve has historically appeared before some recessions, which is why it receives so much attention. However, it should not be treated as a guaranteed recession signal.
Financial markets are constantly responding to new information, and the reasons behind an inversion can vary.
For example, an inversion may reflect expectations of future interest-rate cuts without necessarily indicating an imminent economic collapse.
Investors should therefore view the yield curve as one economic indicator among many rather than as a precise forecasting tool.
What Is a Flat Yield Curve?
A flat yield curve occurs when short-term and long-term yields are relatively close to each other.
For example, a 2-year government bond might yield 4.0%, while a 10-year bond yields 4.1%.
There is little difference between the two.
A flat curve can indicate uncertainty about the future. Investors may be unsure whether interest rates will rise, fall, or remain relatively stable.
The shape can also change over time as economic expectations develop.
What Causes the Yield Curve to Change?
The yield curve can move because of changing expectations about monetary policy, inflation, economic growth, and investor demand.
Central bank decisions can have a significant effect on short-term interest rates.
However, longer-term yields are influenced by broader expectations about the economy. Investors consider where inflation and interest rates might be several years from now, not just where they are today.
Large changes in demand for government bonds can also influence yields. When demand increases, bond prices generally rise and yields fall. When demand weakens, prices can decline and yields can rise.
The Yield Curve and Central Banks
Central banks pay close attention to financial conditions when making monetary policy decisions.
When a central bank raises short-term interest rates, shorter-maturity bond yields may respond quickly. Longer-term yields may move differently depending on what investors expect will happen to inflation and economic growth.
This can cause the yield curve to steepen, flatten, or invert.
The important point is that the yield curve reflects both current interest rates and market expectations about the future.
How Investors Use the Yield Curve
Investors can use the yield curve to understand the relative attractiveness of bonds with different maturities.
A pension fund, bank, investment manager, or individual investor might examine the curve when deciding whether to hold short-term or long-term bonds.
The curve can also influence decisions in other financial markets. Changes in government bond yields can affect stock valuations, corporate borrowing costs, and currency markets.
However, the yield curve does not tell investors exactly what will happen next. It describes current market pricing and expectations, which can change rapidly when new economic information becomes available.
Why the Yield Curve Is Important to Financial Markets
The yield curve connects several major parts of the financial system.
It reflects expectations about interest rates and inflation, influences borrowing costs, and provides information about how investors view economic conditions.
Rather than focusing on one particular yield, investors can examine the entire curve to understand how the market values money across different time periods.
That makes the yield curve one of the most useful tools for understanding the bond market and the broader financial environment.
The Key Takeaway
The yield curve shows how bond yields vary across different maturities.
An upward-sloping curve generally means longer-term yields are higher than short-term yields.
A flat curve means yields across different maturities are relatively similar.
An inverted curve means short-term yields are higher than long-term yields.
The shape of the curve can provide valuable information about expectations for interest rates, inflation, and economic growth. But it is best used as part of a broader analysis rather than as a standalone prediction of what the economy will do next.
Leave a Reply